The Real Estate Cycle - A Tale of Two Countries
In this edition of the Bird’s Eye View, we explore the stages of the real estate cycle, focusing on the multifamily asset class, and compare the very different positioning between the United States and Canada within this cycle. Let’s explore this tale of two countries!
“It was the best of times, it was the worst of times, it was the age of wisdom, it was the age of foolishness, … it was the spring of hope, it was the winter of despair …”
- Charles Dickens, A Tale of Two Cities, 1859
Cliché? Yes. Does it aptly describe the current real estate environment? Yes.
For multifamily investors in many US submarkets, where residential vacancy rates are over 10%, things may be feeling ‘wintery’. But for investors in Canadian markets who are looking down the barrel of an unprecedented wave of demand and constrained supply, it should feel like spring. Why doesn’t it?
In this edition of the Bird’s Eye View, we explore the stages of the real estate cycle, focusing on the multifamily asset class, and compare the very different positioning between the United States and Canada within this cycle. Let’s explore this tale of two countries!
The Real Estate Cycle
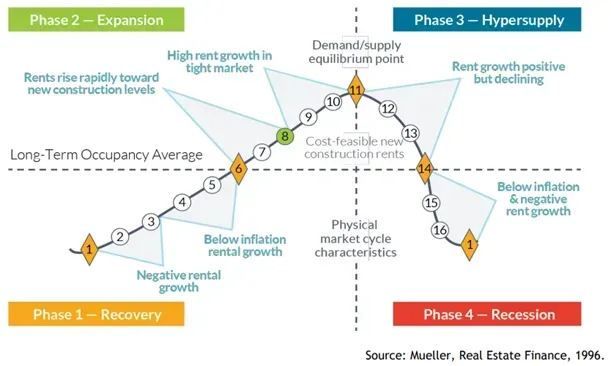
Dr. Glenn Mueller, a professor at the University of Denver, developed a simple model for the real estate cycle that provides a useful starting point for analysis. His real estate cycle model is separated into 4 phases and 16 points, as follows:

There are patterns associated with each phase of the real estate cycle, and while this article will provide a cursory overview, a more detailed review is covered in Dr. Mueller’s most recent real estate market cycle monitor report:
Phase 1 – Recovery
The market is in a state of oversupply, either from previous new construction or negative demand growth. Point 1 is generally where new supply from the previous cycle stops coming online and new building stops or is massively curtailed. This phase continues as demand slowly absorbs oversupply.
Phase 2 – Expansion
As supply begins to tighten, rents begin to rise and reach a level that makes development and investment cost-feasible (Point 8). Capital flows into real estate to take advantage of favourable rents and price appreciation. Demand continues to outstrip supply, gradually pushing rents and occupancy higher until equilibrium is reached.
Phase 3 – Hypersupply
Categorized by supply growth rising above demand growth. Very often, market participants don’t immediately recognize it as rent growth and occupancy rates remain above long-term averages. As participants confirm the trend, new capital inflow and construction halts or drastically slows.
Phase 4 – Recession
Due to the long lead time in real estate, markets have limited ability to react to new information and projects continue to come online for a period, widening the oversupply gap. Rents and occupancy fall as landlords compete for occupancy. The cycle reaches a trough when completions cease, or demand begins to grow at a rate higher than the new supply being added to the market.
With a description of the cycle itself out of the way, you probably have some inklings of where both the US and Canada are currently at within this cycle.
A Tale of Two Countries
Canada
In 2023, Canada saw the highest population growth rate since 1957 (3.2%), record low vacancy rates (1.5%) and record high rental growth rates (8.0%) in multifamily rental properties (CMHC Rental Market Report, January 2024), with these rates being even more extreme in Toronto and Vancouver. These factors point to Canada being in the “Expansion” phase of the market cycle, where the typical outcome is an influx of capital and development until an equilibrium is reached.
To understand why this hasn’t happened, investors need to consider both the supply and demand sides of the equation.
Demand
Demand in Canada is almost entirely driven by permanent and temporary immigration, which accounts for 97.6% of population growth in Canada (Statistics Canada, March 27 2024). That report states, “Most of Canada's 3.2% population growth rate stemmed from temporary immigration in 2023. Without temporary immigration, that is, relying solely on permanent immigration and natural increase (births minus deaths), Canada's population growth would have been almost three times less (+1.2%).”
While the Federal Government has given clear indication that it intends to continue with its planned levels of permanent immigration (485,000 people in 2024 and 500,000 in 2025 and 2026, 2024-2026 Immigration Levels Plan), the same cannot be said for temporary immigration. Immigration Minister Marc Miller recently signaled the Ministry’s intention to reduce the proportion of non-permanent residents to 5% of the population by 2027, which will mean a reduction of ~525,000 people from the current pool of 2.66M non-permanent residents in Canada.
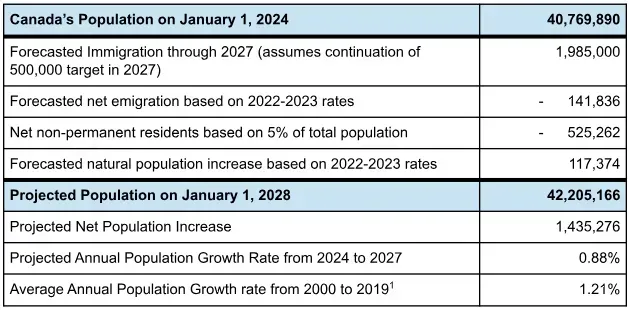
Using this information and data from Statistics Canada (Table 17-10-0040-01), we can create a simplistic model to forecast population growth through 2027:

Source: Statistics Canada. Table 17-10-0009-01 Population estimates, quarterly
This simple model serves to show that if stated immigration policy holds, Canada will likely be entering a 4-year period of below average population growth.
Additionally, since non-permanent residents have been prohibited from purchasing property since January 1, 2023 (with exceptions, source), that population being reduced should have an oversized impact on cooling demand in the rental market in particular.
Supply
Despite governments at every level and the development community agreeing that we are in a housing crisis, the number of housing starts went down in 2023 compared to 2022, from 240,590 to 223,513 (CMHC).
There are 4 primary constraints that have prevented developers from being able to quickly respond to the demand shock that sent rent and occupancy rates rocketing:
- High land, interest, and building costs.
- Scarcity of economically viable land for development (ALR and Crown land is locked up).
- Comparatively slow entitlement and permitting processes. There are welcome attempts in many jurisdictions to improve this, though we have a long way to go.
- Even if projects get approved and funded, Canada doesn’t have sufficient construction and trades workforce to aggressively increase supply.
What this means for Canada
Looking purely at Canada’s rent and occupancy rate growth, one might expect investment dollars to be pouring into real estate and new buildings to be popping up like dandelions in the Spring, but a deeper dive reveals that investment conditions aren’t as attractive as they look on the outside.
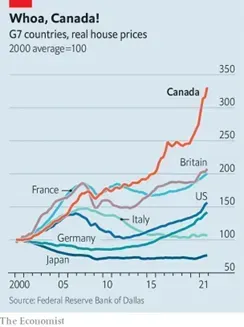
Since costs are so high, the investment case for multifamily in Canada is highly dependent on increasing rents and asset prices. Canada already has comparatively expensive housing, and with a period of below-average population growth on the horizon, we believe that the current ‘expansion’ indicators are unlikely to lead to continued high rent growth and low vacancy.
There are attractive development projects in Canada, though it's not the majority of deals and in our view, savvy investors ought to be paying particularly close attention to whether projects are forecasting continued high rent growth or price appreciation to justify their returns. Even in a tight market, the high costs of development and potentially slowing demand have us skeptical that we will see the uptick in development and investment that Canada sorely needs.

Source: The Economist
The United States
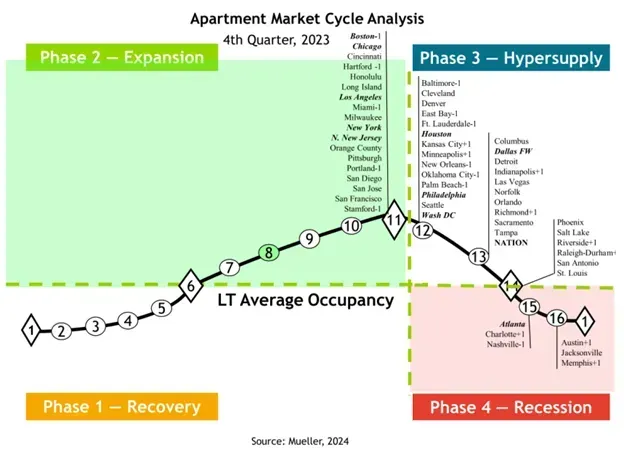
Unlike Canada, most submarkets in the US are somewhere in the Hypersupply and Recession phases. According to CoStar data, the US saw 583,000 multi-family units completed in 2023 (a 40-year high), with another 460,000 units anticipated for completion in 2024 (source). The full year absorption of units in 2023 was 315,000, meaning that the US saw an oversupply of 268,000 units nationally.
While the below chart from Dr. Mueller shouldn’t be used in isolation to determine the positioning of any individual submarkets, it does give a strong sense of where most U.S. urban centres are at in the real estate cycle:

Consistent with these findings, in most markets that we follow, there are very few new projects being started and there continues to be a glut of supply that is coming online.
In some markets, rent growth is still positive but declining, and in others, occupancy has dropped like a rock and rent growth is clearly negative. (For analysis on the Dallas-Fort Worth and Phoenix markets specifically, check out our recent webinar with CoStar.)
It’s not all doom and gloom though. Compared to Canada, it’s nice to see the cycle playing out in a more natural fashion, such that once demand absorbs excess supply, we fully anticipate seeing exciting investment opportunities. In the interim, two strategies worth looking at are investment in those markets near equilibrium, where the data clearly shows strong demand and limited supply moving forward. Alternatively, should assets come up at fire sale prices in Recession markets, there could be interesting opportunities as the next cycle begins.
Conclusion
While Canada and the US are at very different places in the real estate cycle, there are barriers in both countries that limit investment attractiveness.
Canada desperately needs housing and is theoretically in a strong position for investment, though it is challenged by the question of how high prices can go before it materially affects demand. In our view, investors should be looking to invest with developers whose systems and processes give them an edge in driving profit, such that even if rent growth is modest, investors can achieve solid returns.
Most markets in the United States likely need 1-2 years before the next cycle begins in earnest, though we are seeing interesting opportunities in some markets that look to be nearer the equilibrium point, and we are keeping our eye out for distress pricing in recession markets.


