August 24, 2024

How Do Election Results Impact Residential Real Estate Prices?

While we will continue to watch and seek to understand how investors may be affected by who ends up in government and any resulting policy shifts, there is something reassuring about knowing that in the past, real estate has performed well for investors regardless of who is in power.


It’s federal election season in the United States and the Canadian federal election is just a year away.


Elections, particularly federal elections, present the potential for substantial change in a nation’s trajectory. Personally, you might be analyzing how your life, your business, and your investments may be impacted depending on election results.


While we can’t answer that question in all areas, we have conducted research on how the party in power has historically affected real estate values in both the US and Canada.


In this edition of the Bird’s Eye View we analyze this historical data, share our thoughts on weaknesses in the data, and offer commentary on what investors might experience moving forward.


How Federal Government Affects Housing


There are 4 primary ways that federal governments get involved with the supply/demand equation for housing, thereby influencing costs and pricing:


  1. Immigration Policy - Government can increase or decrease demand for housing based on changes to immigration policy (which can also have secondary effects on supply).
  2. Policies that Affect Availability of Land for Development - This is more relevant for Canada than the US, where private land ownership rates are much higher (~60% of land in the US is privately owned, vs. ~11% in Canada).
  3. Direct or Indirect Funding Programs for Housing - These can include subsidies, tax credits, transfer payments, etc.
  4. Taxation - While federal governments don’t control property tax, changes to capital gains, federal sales taxes, or other related taxes can affect real estate project costs and pricing.


For the foreseeable future, all major parties in both the U.S. and Canada are focused on ‘housing affordability’. This isn’t necessarily a new phenomenon, but the focus is definitely more acute than it has been historically, and investors should be aware that governments, regardless of political leaning, are actively trying to reduce housing prices. Where parties differ is in their approach to how they want to see prices lowered, or the specific combination of the factors above, to achieve that goal.


While the means might be different, the data is fascinating in that it shows similar levels of historical price appreciation in the U.S., regardless of which party is in power. In contrast, there has been more divergence between parties in Canada.


Data Summary


United States


The 
All-Transactions House Price Index for the United States tracks residential housing prices that have been securitized by Freddie Mac and Fannie May, back to 1975.


(*If you’ve ever wondered, these nicknames come from the acronyms of each organization: Fannie Mae from the Federal National Mortgage Association (FNMA) and Freddie Mac from the Federal Home Loan Mortgage Corporation (FMCC)).


Here’s how housing prices changed over the last 50 years, based on who has controlled the White House:
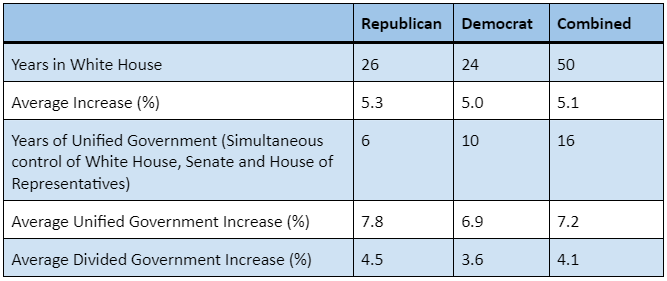
Notable Observations:


  1. On average, historical housing prices have appreciated at a similar rate, regardless of whether Democrats or Republicans are in power.
  2. Unified governments, both Republican and Democrat, saw much higher rates of housing appreciation than divided governments


With regards to unified vs. divided government, it is tempting to hypothesize that unified governments 
cause higher rates of appreciation. However, this can’t be determined without further study, and in our opinion, this relationship is much more likely to be coincidence, as shown by the very different Canadian experience with Majority/Minority governments.


Canada


Canada doesn’t have a direct equivalent to the U.S All-Transaction Housing Price Index, however, it does have the 
New Housing Price Index, which beginning in 1981 measures changes only in the sale prices of new homes (and land) in 27 cities across Canada.


The following table shows average price changes since 1981, relative to who was in power and whether they formed a majority or minority government:
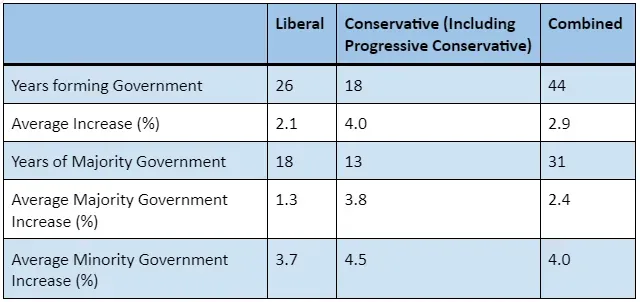
Notable Observations:


  1. Conservative (including Progressive Conservative) governments have seen higher home price appreciation on average than Liberal governments.
  2. Minority governments have seen much higher levels of price appreciation than Majority governments, the exact opposite of what the US has experienced with unified governments.


Shortcomings of the Data


Given the simplicity of the data reviewed and our approach to it, it’s necessary that we acknowledge some of the key issues with the use of this data.


First, the significant differences between the US and Canadian indexes makes comparing raw percentages between the two problematic.


Second, there are many other economic factors that affect housing prices at the national level, such as interest rates, GDP, consumer confidence, and consumer debt levels. Analyzing the single variable of who is in government without also analyzing those other variables means we can’t properly measure the impact of government on housing prices (and whether it is causal, correlational, or pure coincidence). As such, this data has limited value for explaining 
why prices have appreciated at any given rate.


Third, any fulsome study on this topic should look at the change in housing prices relative to the change in housing costs, which we didn’t do here. Looking at housing price changes alone is only half the picture.


Conclusion


In the US, there has been little difference between Democrat and Republican governments when it comes to home price appreciation, while Conservative governments have historically seen higher levels of price appreciation in Canada.


Unified governments in the US have seen much higher rates of price growth than divided governments, but in Canada, the opposite has been true. Minority governments have seen much higher price growth than Majority governments.


Perhaps there are structural explanations for the different experiences between countries, but much more likely is that other economic factors are more important in driving price changes.


While we will continue to watch and seek to understand how investors may be affected by who ends up in government and any resulting policy shifts, there is something reassuring about knowing that in the past, real estate has performed well for investors regardless of who is in power.

Author

Hawkeye Wealth Ltd.

Date

August 24, 2024

Share

By Hawkeye Wealth Ltd. November 1, 2025
“To a landowner, there is nothing more important than security of title. Once you have fee-simple title in B.C., it has to mean that land is your land. And that is very fundamental to our province – and in fact, to the country.” - Niki Sharma, BC Attorney Genera l
By Hawkeye Wealth Ltd. October 4, 2025
Introduction Canadian farmland hasn’t posted a single annual decline in value since 1992 . Take a second to soak that up. More than thirty years, multiple recessions, inflation spikes, a housing crash and a tech- bubble. Through it all, farmland kept climbing. In a world where many asset classes appear vulnerable to technological disruption or shifting consumer preferences, the core value in farmland is tied to a necessity that will always remain constant. Food. In this edition of the Bird’s Eye View , we discuss the case for investing in Canadian farmland and share the most compelling points and potential risks from our due diligence on this asset class.  The Investment Case for Canadian Farmland In our view, farmland has six main features that make farmland investment attractive: 1. Consistent Performance and Low Volatility - A 30+ year track-record of positive annual returns is astounding, even more so when you consider that the average annual increase over that period has been 8.1%. Past performance doesn’t guarantee future returns, but there is merit to the fact that farmland has been remarkably consistent through periods of high market volatility. When considering that the figures above don’t account for any profit from the land, farmland has done an impressive job of delivering returns comparable to U.S. equities, but with a volatility profile that more closely resembles bonds. 2. Natural Scarcity - Most cities are established near fresh water and fertile soil. Thus as populations grow and cities expand, that development inherently reduces the base of potential farmland. While most provinces have some level of agricultural land protection program in place, the fact remains that there is a finite amount of farmable land, and each year there is less of it. 3. Diversification and Inflation Hedge - Farmland has a long track record of holding its value when inflation eats away at other assets. Rising food prices translate directly into stronger farm revenues, which in turn support rental income and land appreciation. Additionally, over the last 50 years, farms have averaged an increase in productivity of ~1.5% per year by adopting new technology and processes (machinery, irrigation, nutrient management), which serves as a natural inflation hedge. Unlike equities or bonds, farmland’s performance has shown little correlation with public markets , giving it genuine diversification benefits. 4. Investor-Tenant Alignment - For anyone feeling exhausted with the rhetoric about ‘greedy developers’, it may come as welcome news that investors and landlords aren’t automatically the bad guy in the farmland space. Research shows that farmers are able to drive higher levels of profitability per acre when renting compared to when purchasing farmland , and that trend is accelerating. While renting doesn’t necessarily outperform ownership over the long-run when accounting for land appreciation benefits, it does improve cashflow. Since farming is capital intensive, renting land allows farmers to allocate funds that would have otherwise gone to land, toward equipment and operations that improve yield and profitability. Since farmers’ profitability depends on sustaining yields, they are naturally incentivized to care for the soil and manage the land well, which not only supports their own returns but helps preserve and even enhance the underlying land value. As a result, the ‘renter’s mentality’ sometimes seen in other real estate sectors is far less common in farming. 5. Comparative Affordability - In housing, the current challenge is that people can’t afford to pay what developers can feasibly build. In comparison, while farms are comparatively less affordable than they were 5 years ago, the gap is far less dramatic than it has been in housing. Farm values and rents have rapidly increased, but the revenue generated by those farms has also substantially increased , which has slowed the loss of affordability. While current affordability levels are still a concern in the space, farmers can still operate profitably at current price levels and as shown on the chart below from Farm Credit Canada , we are nowhere near the peaks of unaffordability that farmers experienced during the 1980’s:
By Hawkeye Wealth Ltd. August 23, 2025
Introduction On paper, the cure for unaffordable housing is simple: build more. In practice, the very act of building undermines the incentive to keep building. The federal government has set a target of 500,000 new homes per year by 2035, but supply follows returns, not political will. As more units come online, margins shrink and investors retreat, a dynamic made worse by slowing population growth. In response, experts across Canada have signed competing open letters and budget submissions, each offering prescriptions for how to restore affordability. In this edition of The Bird’s Eye View , we explore the widening gap between Canada’s housing ambitions and the market realities on the ground. We look at why supply targets are so difficult to reach, how policy prescriptions diverge between advocates and developers, and where governments may need to adjust course to bring targets and incentives into alignment. The Scale of the Challenge By 2035, the federal government wants to see 500,000 new homes started each year ( Source ). CMHC estimates that for that same year, between 430,000 and 480,000 annual starts will be needed to restore affordability to 2019 levels ( Source ). Hitting these targets means roughly doubling today’s pace of 245,367 starts. The critical, often unstated requirement behind these supply targets is profitability. If projects don’t offer an attractive risk-adjusted return, they simply won’t get built. That challenge is already visible in Vancouver and Toronto, where housing starts are down because many projects just aren’t worth the risk of building for the returns projected. In the CMHC’s Housing Market Outlook Summer Update , CMHC cut housing start forecasts for every year from 2025–2027, with the 2027 baseline revised downward by 5.5% only five months after the previous forecast: