November 25, 2023

Making Sense of Negative Cap Rate Spreads

In this edition of the Birds Eye View, we cover what cap rates are, their relationship with interest rates, then dive into why seeing negative cap rate spreads is so strange.

In the DC Comic book universe, there is a planet named “Htrae” (Earth spelled backwards). On Htrae, everything happens opposite to expectations. Up is down, hello means good-bye, and people qualify for leadership only if they can demonstrate a sufficient level of stupidity. On Htrae, one of the best selling financial instruments are bonds that are guaranteed to lose you money.

While we aren’t quite to the level of Htrae (with the possible exception of government leadership), the commercial real estate market here on Earth has some truly backward features at the moment, with the most notable being negative cap rate spreads in some markets and asset classes.

In this edition of the Birds Eye View, we cover what cap rates are, their relationship with interest rates, then dive into why seeing negative cap rate spreads is so strange.


What are Cap Rates?

Cap rates (short for capitalization rates) are a commonly used metric used to evaluate the profitability (and indirectly, risk) of commercial real estate investments. The equation for calculating cap rates is as follows:

Cap Rate (%) = Net Operating Income (NOI) ÷ Market Value of property


The cap rate thus indicates the annual return of the investment if you bought the property with no debt. More risky assets will generally have a higher cap rate (out of favour asset class, less desirable location, vacant or older buildings), while more stable properties will have a lower cap rate.


The relationship between Interest Rates and Cap Rates
Interest rates and cap rates usually run together, with a variable spread between them. When interest rates rise, cap rates tend to increase as well. Higher interest rates mean higher borrowing costs, such that investors will require a higher return on their investment to compensate for the increased cost. When interest rates are low, cap rates decrease since borrowing costs are lower.

While the chart below is only current to Q1 2023, it does an excellent job at portraying historical cap rate spreads between the relevant interest rates, and the recent narrowing of that spread:


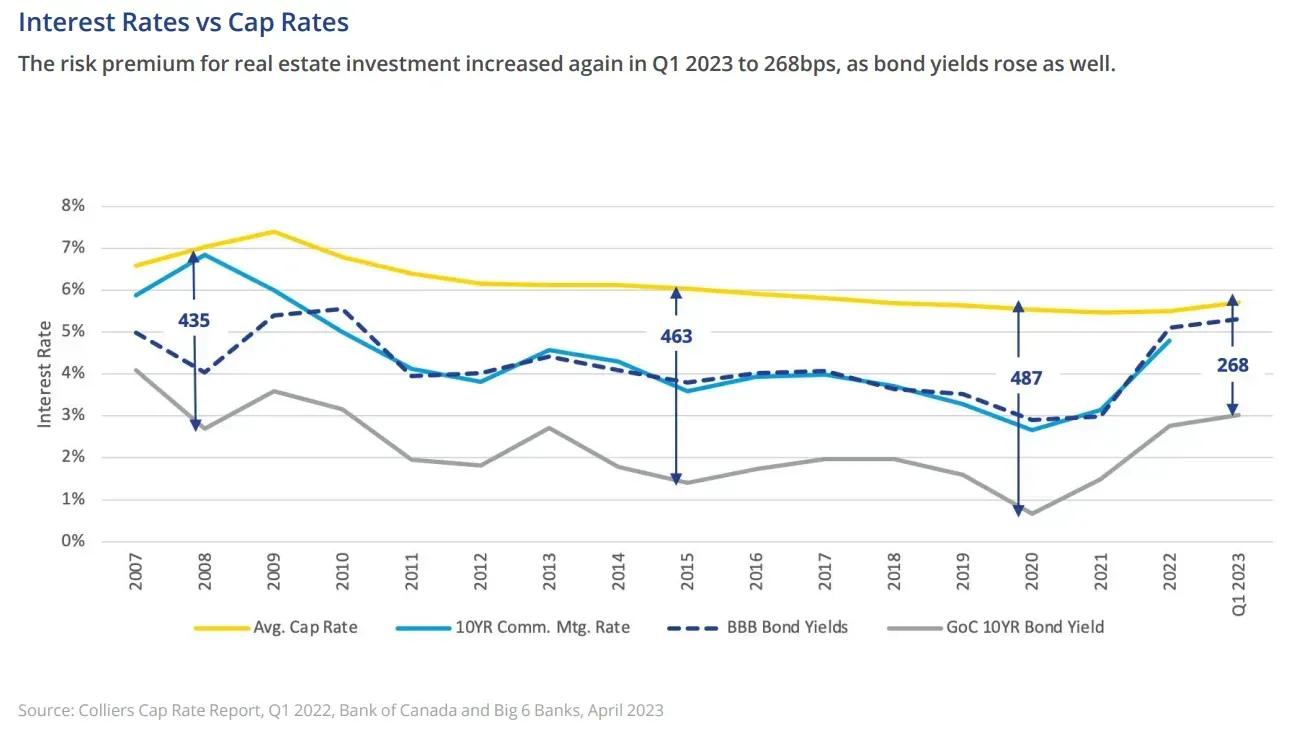
The 15-year historical average spread between the 10-year treasury yield and cap rates in Canada has been ~400bps.  In other words, investors have historically required an average of 4% additional yield over the risk-free rate to be induced to invest in commercial real estate.


While the above averages include all markets and asset classes, there is considerable variance across these.  For example, Altus Group data from Q3 2023 indicates that there is more than 200bps of spread between the cap rates for suburban multi-family residential (4.66% cap rate) and downtown class “AA” office (6.69% cap rate).


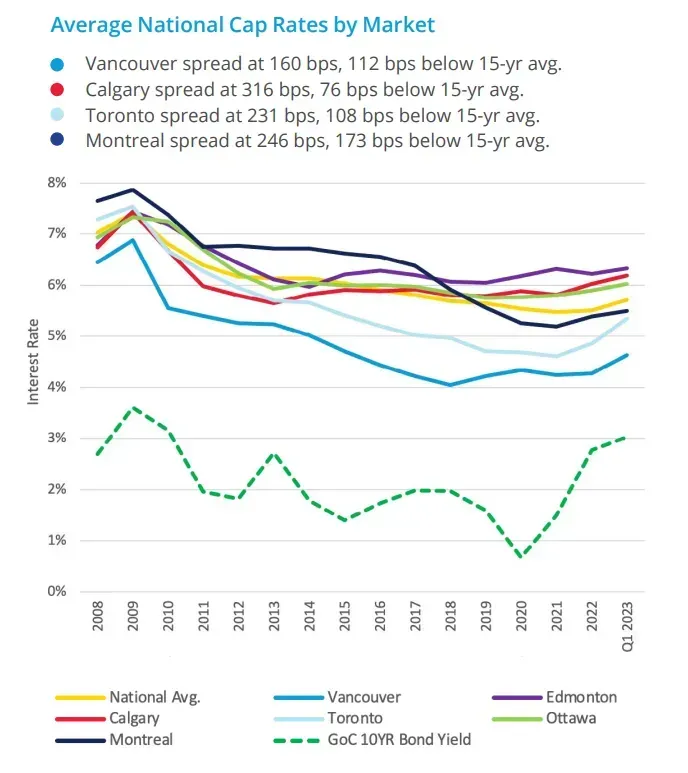
Data from Colliers (see right) also shows the considerable variance between average national cap rates based on market.


On average, cap rates in Vancouver tend to be lower than cap rates in Alberta.  In all markets, the cap rate spreads are considerably below historical averages.


If history is a guide and interest rates stay higher for longer as has been forecasted by the Bank of Canada, we anticipate that asset prices will fall and cap rates will likely rise over time and settle in closer to historical averages.


Introducing the Negative Cap Rate Spread

From March 2023 (when the above charts were produced) to now, 10-year bond yields have risen aggressively on the strength of ‘higher rates for longer’ rhetoric from the Bank of Canada, to where they now sit at 3.725%.  Cap rates have edged up, but multi-family cap rates have remained sticky due to strong market fundamentals. In short, the spreads have narrowed even further.


So where does that put us? According to Colliers Q3 Canada Cap Rate Report, some markets and asset classes are firmly in negative cap rate spread territory. For example, in Vancouver, multi-family apartments have been trading at cap rates of between 3.25% - 4.00%.


It begs the question of why investors are choosing to invest in a real estate asset at a going-in cap rate of 3.5% if they can go get a 10-year, risk-free bond at 3.725%.  Said another way, why do some investors view multi-family assets in select markets as having less risk than the risk-free rate? It’s a strange world indeed.

Sources

Colliers Q3 Canada Cap Rate Report / Colliers Q1 Canada Cap Rate Report

MarketWatch - Canadian 10 Year Bond

Altus Group Report Q3 2023


Forward Looking Statements

This material is not intended to be relied upon in connection with a purchase of securities. This article is for informational purposes only and do not constitute an offer to sell or a solicitation to buy any securities referred to herein. This article includes forward looking statements that do not constitute a guarantee of future performance and are based on assumptions and estimates using the data and information provided.

Author

Hawkeye Wealth Ltd.

Date

November 25, 2023

Share

By Hawkeye Wealth Ltd. January 31, 2026
Introduction "It was never my thinking that made the big money for me. It was always my sitting. Got that? My sitting tight!" - Jesse Livermore “The big money is not in the buying and the selling, but in the waiting” - Charlie Munger It’s easy to feel unconfident as an investor today. We are currently operating in a market of ‘brittle optimism’, where major indices flirt with all-time highs while headlines warn of trade wars, a potential AI bubble burst, and the destabilization of institutions. For many people, the natural instinct in the face of volatility and future uncertainty is to protect what they have by taking defensive positions, hedging, or selling altogether until the future feels rosy again. But that doesn’t appear to be what the wealthy are doing. In this edition of the Bird’s Eye View, we consider the data from three wealth reports ( Tiger 21 , Knight Frank , and Capgemini ) to see how different cohorts of the wealthy are positioning their portfolios, and how their portfolio construction is changing in response to uncertainty. Asset Allocations by Investor Profile The table below represents the most recent reported weightings and rankings across the three major cohorts. Note that while Tiger 21 and Capgemini provide percentage-based portfolios, the Knight Frank data reflects rankings by weight within institutional family offices.
By Hawkeye Wealth Ltd. December 20, 2025
“The provincial government has provided local government with only two options to build infrastructure: development cost charges and property taxes. And I will always be on the side of property taxpayers, and we will look for developers and ‘growth to pay for growth’ as a principle.” - BC Mayor, Oct 9, 2024
By Hawkeye Wealth Ltd. November 1, 2025
“To a landowner, there is nothing more important than security of title. Once you have fee-simple title in B.C., it has to mean that land is your land. And that is very fundamental to our province – and in fact, to the country.” - Niki Sharma, BC Attorney Genera l